Server Logs (Grafana)
Important: The following instructions rely on Grafana and a Grafana account. To install Grafana or configure a Grafana account, refer to the Grafana: System Monitoring section of the ICE Server Installation Guide.
Grafana is an open source analytics and interactive visualization web application providing charts, graphs, and alerts when connected to supported data sources. Grafana serves as the presentation layer for Prometheus (metrics) and Loki (logs).
Prometheus is an open source tool used for event monitoring and alerting. Prometheus records real time metrics in a time series database with flexible queries and real time alerting. Loki is an open source log aggregation system designed for resource efficiency and ease of operation.
To view server logs
1. In ICE Desktop, navigate to the Settings > General > Reporting tab.
2. Click the Grafana button.
The Grafana login page opens.
The Grafana login page opens.
3. Log in to Grafana using the credentials supplied by your administrator.
4. Select Explore from the Compass icon menu.


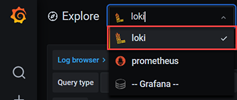
5. From the resulting Explore page, make sure Loki is selected data source.


6. Select the Log browser button.
7. From the resulting screen, select the data label(s) and then, for each label, select the data value(s).
8. Select the Show logs button to view the server logs.