Call Data Records (CDR)
ICE CDR may be viewed using Grafana.


Grafana, which serves as the presentation layer for Prometheus (metrics) and Loki (logs), is an open source analytics and interactive visualization web application providing charts, graphs, and alerts for the web when connected to supported data sources. Prometheus is an open source tool used for event monitoring and alerting, records real‑time metrics in a time series database, with flexible queries and real‑time alerting. Loki is an open source log aggregation system designed for resource efficiency and ease of operation.
To view Call Data Records
1. From the General screen, select the Grafana button to open Grafana within the desktop app's built-in web browser.
2. Optionally, select the Open in Browser button to open Grafana in an external web browser.
Note: While you can continue to view Grafana from within ICE Desktop, the external web browser view is recommended as it makes full use of your screen, allowing for more information to be visible at once.
3. Select Manage from the Dashboards menu.
4. From the resulting dashboard list, select the CDR dashboard.
Data | Description |
Timestamp | When the call occurred. |
Channel | The channel on which the call occurred. |
Call Trace ID | Unique system identifier for the call (a transmit and the corresponding receives). |
Person ID | Unique system identifier for the user. |
Person | Configured user name displayed in the UI. |
Tx/Rx | The type of call activity: tx (transmit), rx (receive), txcall (direct call transmit), rxcall (direct call receive) |
Duration | The duration of the call. |
Latitude | The user's latitudinal location during the call. |
Longitude | The user's longitudinal location during the call. |
Location Age | How long ago the location data was captured, i.e, how old it is. |
To Sort, Query, Filter CDR
1. Click the column headers to toggle between ascending/descending sorts.
2. Click the column filter button to filter by selected column values.
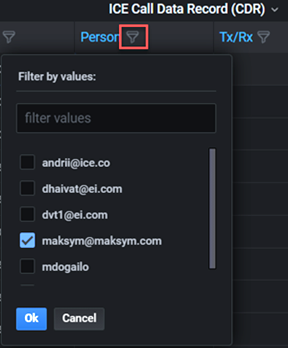

Enter a value in the Query field, then select Enter on your keyboard to refine the records displayed.
Tip: Triple-click a CDR value to select it.
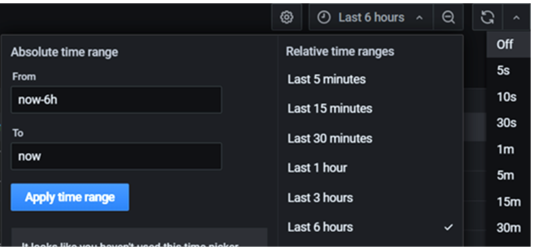
Click the Time Range dropdown to configure a custom time range or to select a predefined one.
Select the Refresh button to manually refresh the data, or select the adjacent dropdown to configure auto refreshes at scheduled intervals.
To download a CDR file
1. From the CDR dropdown, click Inspect.
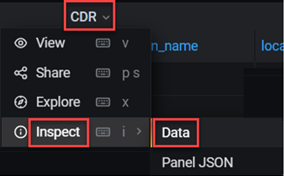

2. From the Data tab of the resulting Inspect screen, enable Apply panel transformations.
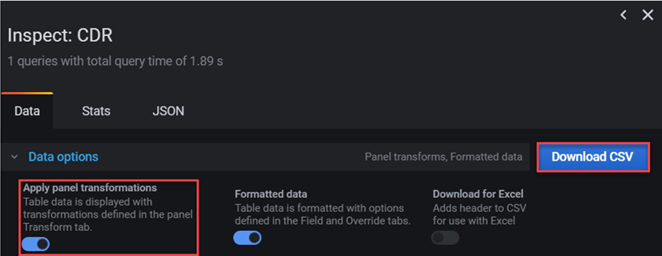

3. Click the Download CSV button to download the CDR dashboard data as a CSV file. The file contains the data currently displayed, reflecting any filters in effect.