
Interacting with Server Logs
For more on exploring server logs with Grafana/Loki, please see the following Grafana documents:
To download server logs
1. Run the server log (see the View Server Logs section above).
2. Click the Inspector button.
3. Click the Data tab.
4. In the Data tab, select the Download CSV button to download the serve log data as a CSV file.
To obtain APIs for Server Logs
1. Use the following instructions to obtain the API key.
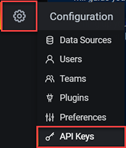
2. From the Configuration (gear icon) dropdown, and select API Keys.

3. From the API Keys tab of the Configuration page, select the Add API key button.
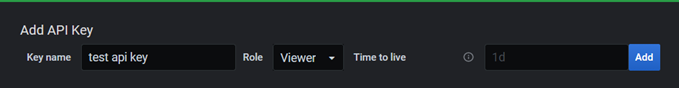
4. Enter the API key name, role and expiration (leave blank if no expiration desired), and select the Add button. 
5. From the resulting API Key Created popup, copy the API key.
Note: You can only view this key here this one time, so be sure to copy it now!
6. Use the following instructions to obtain the URL.
A. Run the server log (see the View Server Logs section above).

B. Click the Inspector button.
C. Click the Query Inspector tab.
D. Click the Refresh button.
E. Copy the URL.
7. Combine the API key and URL to create the command. The format is:
curl -H "Authorization: Bearer [API key]" 'https://myserver.instantconnectenterprise.com/grafana/[URL]
For example:
If the API key is:
eyJrIjoiV0IwcGJ5c0Z5c040a2pDeFlDNUtGeXlDWHFZWUkyY0ciLCJuIjoibW4gdGVzdCIsImlkIjoxfQ
and the URL is:
api/datasources/proxy/2/loki/api/v1/query_range?direction=BACKWARD&limit=1000&query=%7Bnamespace%3D%22ice-arcus%22%7D&start=1629402190000000000&end=1629405791000000000&step=2
Then the command is:
curl -H "Authorization: Bearer eyJrIjoiV0IwcGJ5c0Z5c040a2pDeFlDNUtGeXlDWHFZWUkyY0ciLCJuIjoibW4gdGVzdCIsImlkIjoxfQ==" 'https://myserver.instantconnectenterprise.com/grafana/api/datasources/proxy/2/loki/api/v1/query_range?direction=BACKWARD&limit=1000&query=%7Bnamespace%3D%22ice-arcus%22%7D&start=1629402190000000000&end=1629405791000000000&step=2'
Note: The URL in the example command above is encased in single quotes to prevent the terminal from trying to interpret the ? and & characters.