Default Grafana Dashboards
Note: When viewing a dashboard for multiple nodes, be sure to check all of the nodes (not just the initial one displayed), by using the ‘Host’ dropdown at the top of the dashboard screen.
The following pre-built dashboards are available within Grafana by default:
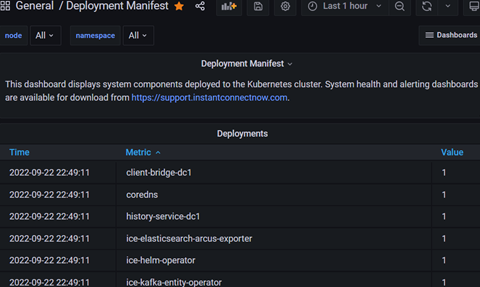
 Manifest:
 Lists the software components deployed on the cluster.

 Call Data Records:
 Shows each person who transmitted audio or made a phone call, and the individuals who received the transmission. For more information on this dashboard, see the
Call Data Records (CDR) section of the
ICE Server Admin Guide.

